Americans with knighthoods or damehoods
Here is a selected list of notable Americans who have been awarded with an honorary knighthood or damehood:
American citizens with honorary British knighthoods and damehoods
Ahead of Thanksgiving in the United States, we look at some of the notable American citizens who have received honorary British knighthoods and damehoods.

Can foreign nationals receive knighthoods or damehoods from the Queen?
Any British national can receive an honour in the British honours system. However, the Foreign Office does also recommend honorary awards for citizens of countries that do not have the Queen as their head of state to be approved by Her Majesty the Queen.
In these cases, the awards are ‘honorary’. Should someone receive an honorary knighthood or damehood, the recipient is entitled to place initials after his/her name. However, unlike citizens of countries that do have the Queen as their head of state, they are not entitled to style themselves ‘Sir’ or ‘Dame’.
Recipients of honorary awards who later become British nationals may also apply to convert their awards to substantive ones, as was the case with violinist and conductor Yehudi Menuhin, Baron Menuhin – who would also go on to receive the Order of Merit (Gazette issue 50849) and a life peerage (Gazette issue 53332) – and business executive Dame Marjorie Scardino.
Americans who have been awarded an honorary knighthood or damehood
For over a century, US citizens have received honorary British knighthoods and damehoods. For example, US Presidents Ronald Reagan, George H W Bush, and Dwight D Eisenhower all became Knights of the Grand Cross of the Most Honourable Order of the Bath. Eisenhower also became an honorary member of the Order of Merit in 1945 for running the Allied campaign during World War 2. (Gazette issue 38205)
In the world of entertainment and the arts, Bob Hope became a Knight Commander of the Most Excellent Order of the British Empire in 1998, while more recently Getty Images co-founder Mark Getty was similarly honoured in 2015. Getty’s father, Paul Getty was also awarded an honorary knighthood in 1986 for services to causes ranging from cricket, to art and to the Conservative Party. His honorary knighthood would eventually become substantive in 1997 upon the required acquisition of British citizenship.
Other famous names to receive honorary knighthoods and damehoods include Bill Gates and his wife Melinda Gates, who received her damehood in 2013 for humanitarian work. Angelina Jolie also became a Dame Commander of the Most Distinguished Order of St Michael and St George in 2014 for her services to the United Kingdom's foreign policy and for campaigning to end sexual violence in war zones.
The Fugitive Slave Clause of the Constitution—Article IV, Section 2, Clause 3—provided that, if a slave escaped to another state, the other state had to return the slave to his or her master. This clause was implemented by the Fugitive Slave Act of 1793, passed by Congress. All Northern states had abolished slavery in some way by 1805; sometimes with completion at a future date, sometimes with an intermediary status of unpaid indentured servant.
From https://en.wikipedia.org/wiki/Slavery_in_the_United_States
| Time period | Quantity |
|---|---|
| 1620–1700 | 21,000 |
| 1701–1760 | 189,000 |
| 1761–1770 | 63,000 |
| 1771–1790 | 56,000 |
| 1791–1800 | 79,000 |
| 1801–1810 | 124,000[338] |
| 1810–1865 | 51,000 |
| Total | 597,000 |
The great majority of enslaved Africans were transported to sugar plantations in the Caribbean and to Portuguese Brazil. As life expectancy was short, their numbers had to be continually replenished. Life expectancy was much higher in the United States, and the enslaved population was successful in reproduction, which was called "natural increase" by enslavers. The population of enslaved people in the United States grew to 4 million by the 1860 census. Historian J. David Hacker conducted research which estimated that the cumulative number of slaves in colonial America and the United States (1619-1865) was 10 million.[339]
Origins of American slaves
| Origins and percentages of Africans imported into British North America and Louisiana (1700–1820)[340][341] | Amount % (exceeds 100%) |
|---|---|
| West-central Africa (Kongo, N. Mbundu, S. Mbundu) | 26.1 |
| Bight of Biafra (Igbo, Tikar, Ibibio, Bamileke, Bubi) | 24.4 |
| Sierra Leone (Mende, Temne) | 15.8 |
| Senegambia (Mandinka, Fula, Wolof) | 14.5 |
| Gold Coast (Akan, Fon) | 13.1 |
| Windward Coast (Mandé, Kru) | 5.2 |
| Bight of Benin (Yoruba, Ewe, Fon, Allada and Mahi) | 4.3 |
| Southeast Africa (Macua, Malagasy) | 1.8 |
Distribution of slaves

| Census Year | # Slaves | # Free Africans | Total Africans | % Free Africans | Total US population | % Africans of total |
|---|---|---|---|---|---|---|
| 1790 | 697,681 | 59,527 | 757,208 | 8% | 3,929,214 | 19% |
| 1800 | 893,602 | 108,435 | 1,002,037 | 11% | 5,308,483 | 19% |
| 1810 | 1,191,362 | 186,446 | 1,377,808 | 14% | 7,239,881 | 19% |
| 1820 | 1,538,022 | 233,634 | 1,771,656 | 13% | 9,638,453 | 18% |
| 1830 | 2,009,043 | 319,599 | 2,328,642 | 14% | 12,860,702 | 18% |
| 1840 | 2,487,355 | 386,293 | 2,873,648 | 13% | 17,063,353 | 17% |
| 1850 | 3,204,313 | 434,495 | 3,638,808 | 12% | 23,191,876 | 16% |
| 1860 | 3,953,760 | 488,070 | 4,441,830 | 11% | 31,443,321 | 14% |
| 1870 | 0 | 4,880,009 | 4,880,009 | 100% | 38,558,371 | 13% |
| Source:"Distribution of Slaves in U.S. History". Retrieved May 13, 2010. | ||||||

| Census Year | 1790 | 1800 | 1810 | 1820 | 1830 | 1840 | 1850 | 1860 |
|---|---|---|---|---|---|---|---|---|
| All States | 694,207 | 893,308 | 1,191,338 | 1,531,490 | 2,009,079 | 2,487,392 | 3,204,215 | 3,953,820 |
| Alabama | – | 494 | 2,565 | 41,879 | 117,549 | 253,532 | 342,844 | 435,080 |
| Arkansas | – | – | 136 | 1,617 | 4,576 | 19,935 | 47,100 | 111,115 |
| California | – | – | – | – | – | – | 0 | 0 |
| Connecticut | 2,648 | 951 | 310 | 97 | 25 | 54 | 0 | 0 |
| Delaware | 8,887 | 6,153 | 4,177 | 4,509 | 3,292 | 2,605 | 2,290 | 1,798 |
| District of Columbia | – | 2,072 | 3,554 | 4,520 | 4,505 | 3,320 | 3,687 | 3,185 |
| Florida | – | – | – | – | 15,501 | 25,717 | 39,310 | 61,745 |
| Georgia | 29,264 | 59,699 | 105,218 | 149,656 | 217,531 | 280,944 | 381,682 | 462,198 |
| Illinois | – | 107 | 168 | 917 | 747 | 331 | 0 | 0 |
| Indiana | – | 28 | 237 | 190 | 3 | 3 | 0 | 0 |
| Iowa | – | – | – | – | – | 16 | 0 | 0 |
| Kansas | – | – | – | – | – | – | – | 2 |
| Kentucky | 12,430 | 40,343 | 80,561 | 126,732 | 165,213 | 182,258 | 210,981 | 225,483 |
| Louisiana | – | – | 34,660 | 69,064 | 109,588 | 168,452 | 244,809 | 331,726 |
| Maine | – | – | – | – | 2 | 0 | 0 | 0 |
| Maryland | 103,036 | 105,635 | 111,502 | 107,398 | 102,994 | 89,737 | 90,368 | 87,189 |
| Massachusetts | 0 | 0 | 0 | 0 | 1 | 0 | 0 | 0 |
| Michigan | – | – | 24 | 0 | 1 | 0 | 0 | 0 |
| Minnesota | – | – | – | – | – | – | 0 | 0 |
| Mississippi | – | 2,995 | 14,523 | 32,814 | 65,659 | 195,211 | 309,878 | 436,631 |
| Missouri | – | – | – | 10,222 | 25,096 | 58,240 | 87,422 | 114,931 |
| Nebraska | – | – | – | – | – | – | – | 15 |
| Nevada | – | – | – | – | – | – | – | 0 |
| New Hampshire | 157 | 8 | 0 | 0 | 3 | 1 | 0 | 0 |
| New Jersey | 11,423 | 12,422 | 10,851 | 7,557 | 2,254 | 674 | 236 | 18 |
| New York | 21,193 | 20,613 | 15,017 | 10,088 | 75 | 4 | 0 | 0 |
| North Carolina | 100,783 | 133,296 | 168,824 | 205,017 | 245,601 | 245,817 | 288,548 | 331,059 |
| Ohio | – | 0 | 0 | 0 | 6 | 3 | 0 | 0 |
| Oregon | – | – | – | – | – | – | 0 | 0 |
| Pennsylvania | 3,707 | 1,706 | 795 | 211 | 403 | 64 | 0 | 0 |
| Rhode Island | 958 | 380 | 108 | 48 | 17 | 5 | 0 | 0 |
| South Carolina | 107,094 | 146,151 | 196,365 | 251,783 | 315,401 | 327,038 | 384,984 | 402,406 |
| Tennessee | 3,417 | 13,584 | 44,535 | 80,107 | 141,603 | 183,059 | 239,459 | 275,719 |
| Texas | – | – | – | – | – | – | 58,161 | 182,566 |
| Utah | – | – | – | – | – | – | 26 | 29 |
| Vermont | 0 | 0 | 0 | 0 | 0 | 0 | 0 | 0 |
| Virginia | 287,959 | 339,499 | 383,521 | 411,886 | 453,698 | 431,873 | 452,028 | 472,494 |
| West Virginia | 4,668 | 7,172 | 10,836 | 15,178 | 17,673 | 18,488 | 20,428 | 18,371 |
| Wisconsin | – | – | – | – | – | 11 | 4 | 0 |
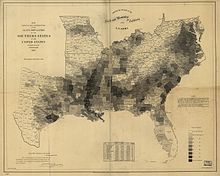
For various reasons, the census did not always include all of the slaves, especially in the West. California was admitted as a free state and reported no slaves. However, there were many slaves that were brought to work in the mines during the California Gold Rush.[345] Some Californian communities openly tolerated slavery, such as San Bernardino, which was mostly made up of transplants from the neighboring slave territory of Utah.[346] New Mexico Territory never reported any slaves on the census, yet sued the government for compensation for 600 slaves that were freed when Congress outlawed slavery in the territory.[347] Utah was actively trying to hide its slave population from Congress[348][349] and did not report slaves in several communities.[350] Additionally, the census did not traditionally include Native Americans, and hence did not include Native American slaves or Native African slaves owned by Native Americans. There were hundreds of Native American slaves in California,[351] Utah[352] and New Mexico[347] that were never recorded in the census.


No comments:
Post a Comment